Variant tracks
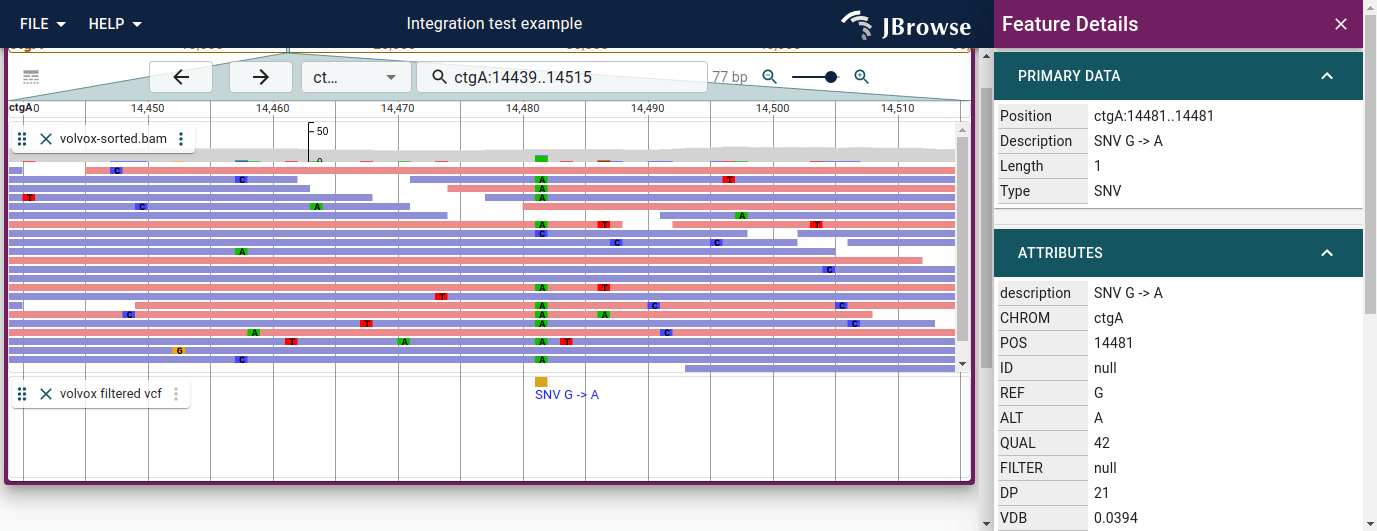
Visualizing variant tracks from the VCF format alongside the original alignment evidence track is a common workflow for validating your results, shown below:
Variant widget
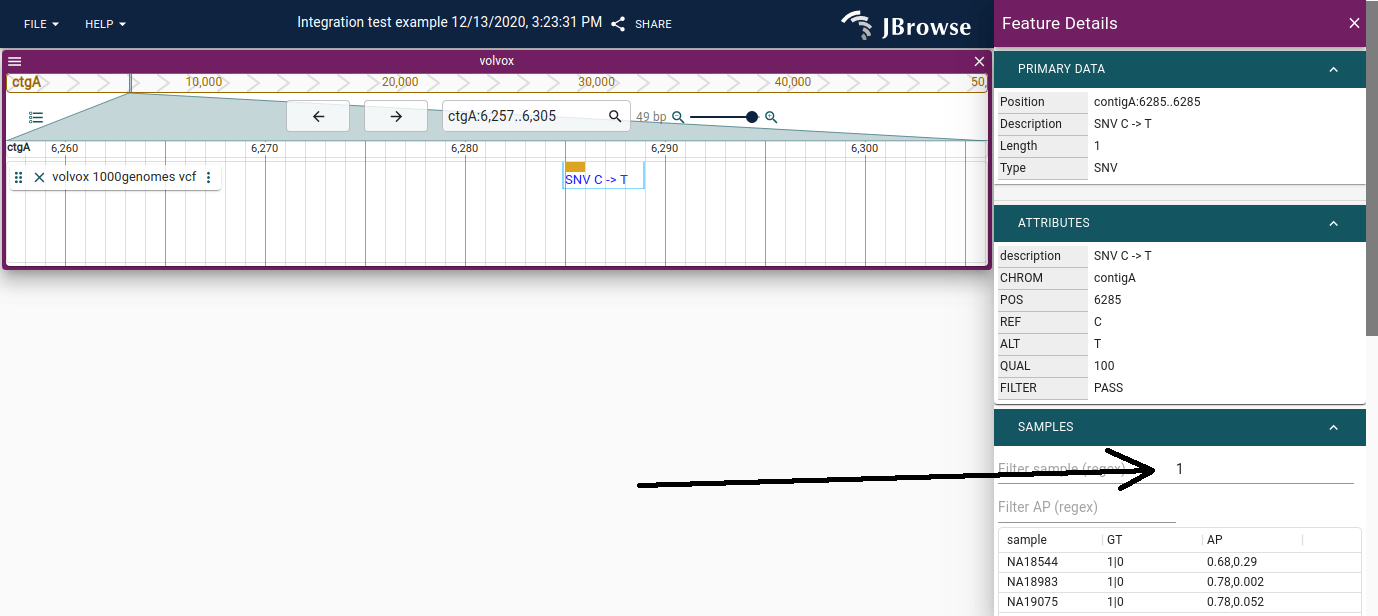
The variant features have a specialized widget that contains a table indicating all the calls that were made in a multi-sample VCF. Some VCF files, like the 1000 genomes VCF, can contain thousands of samples in a single file. This table can display the details.
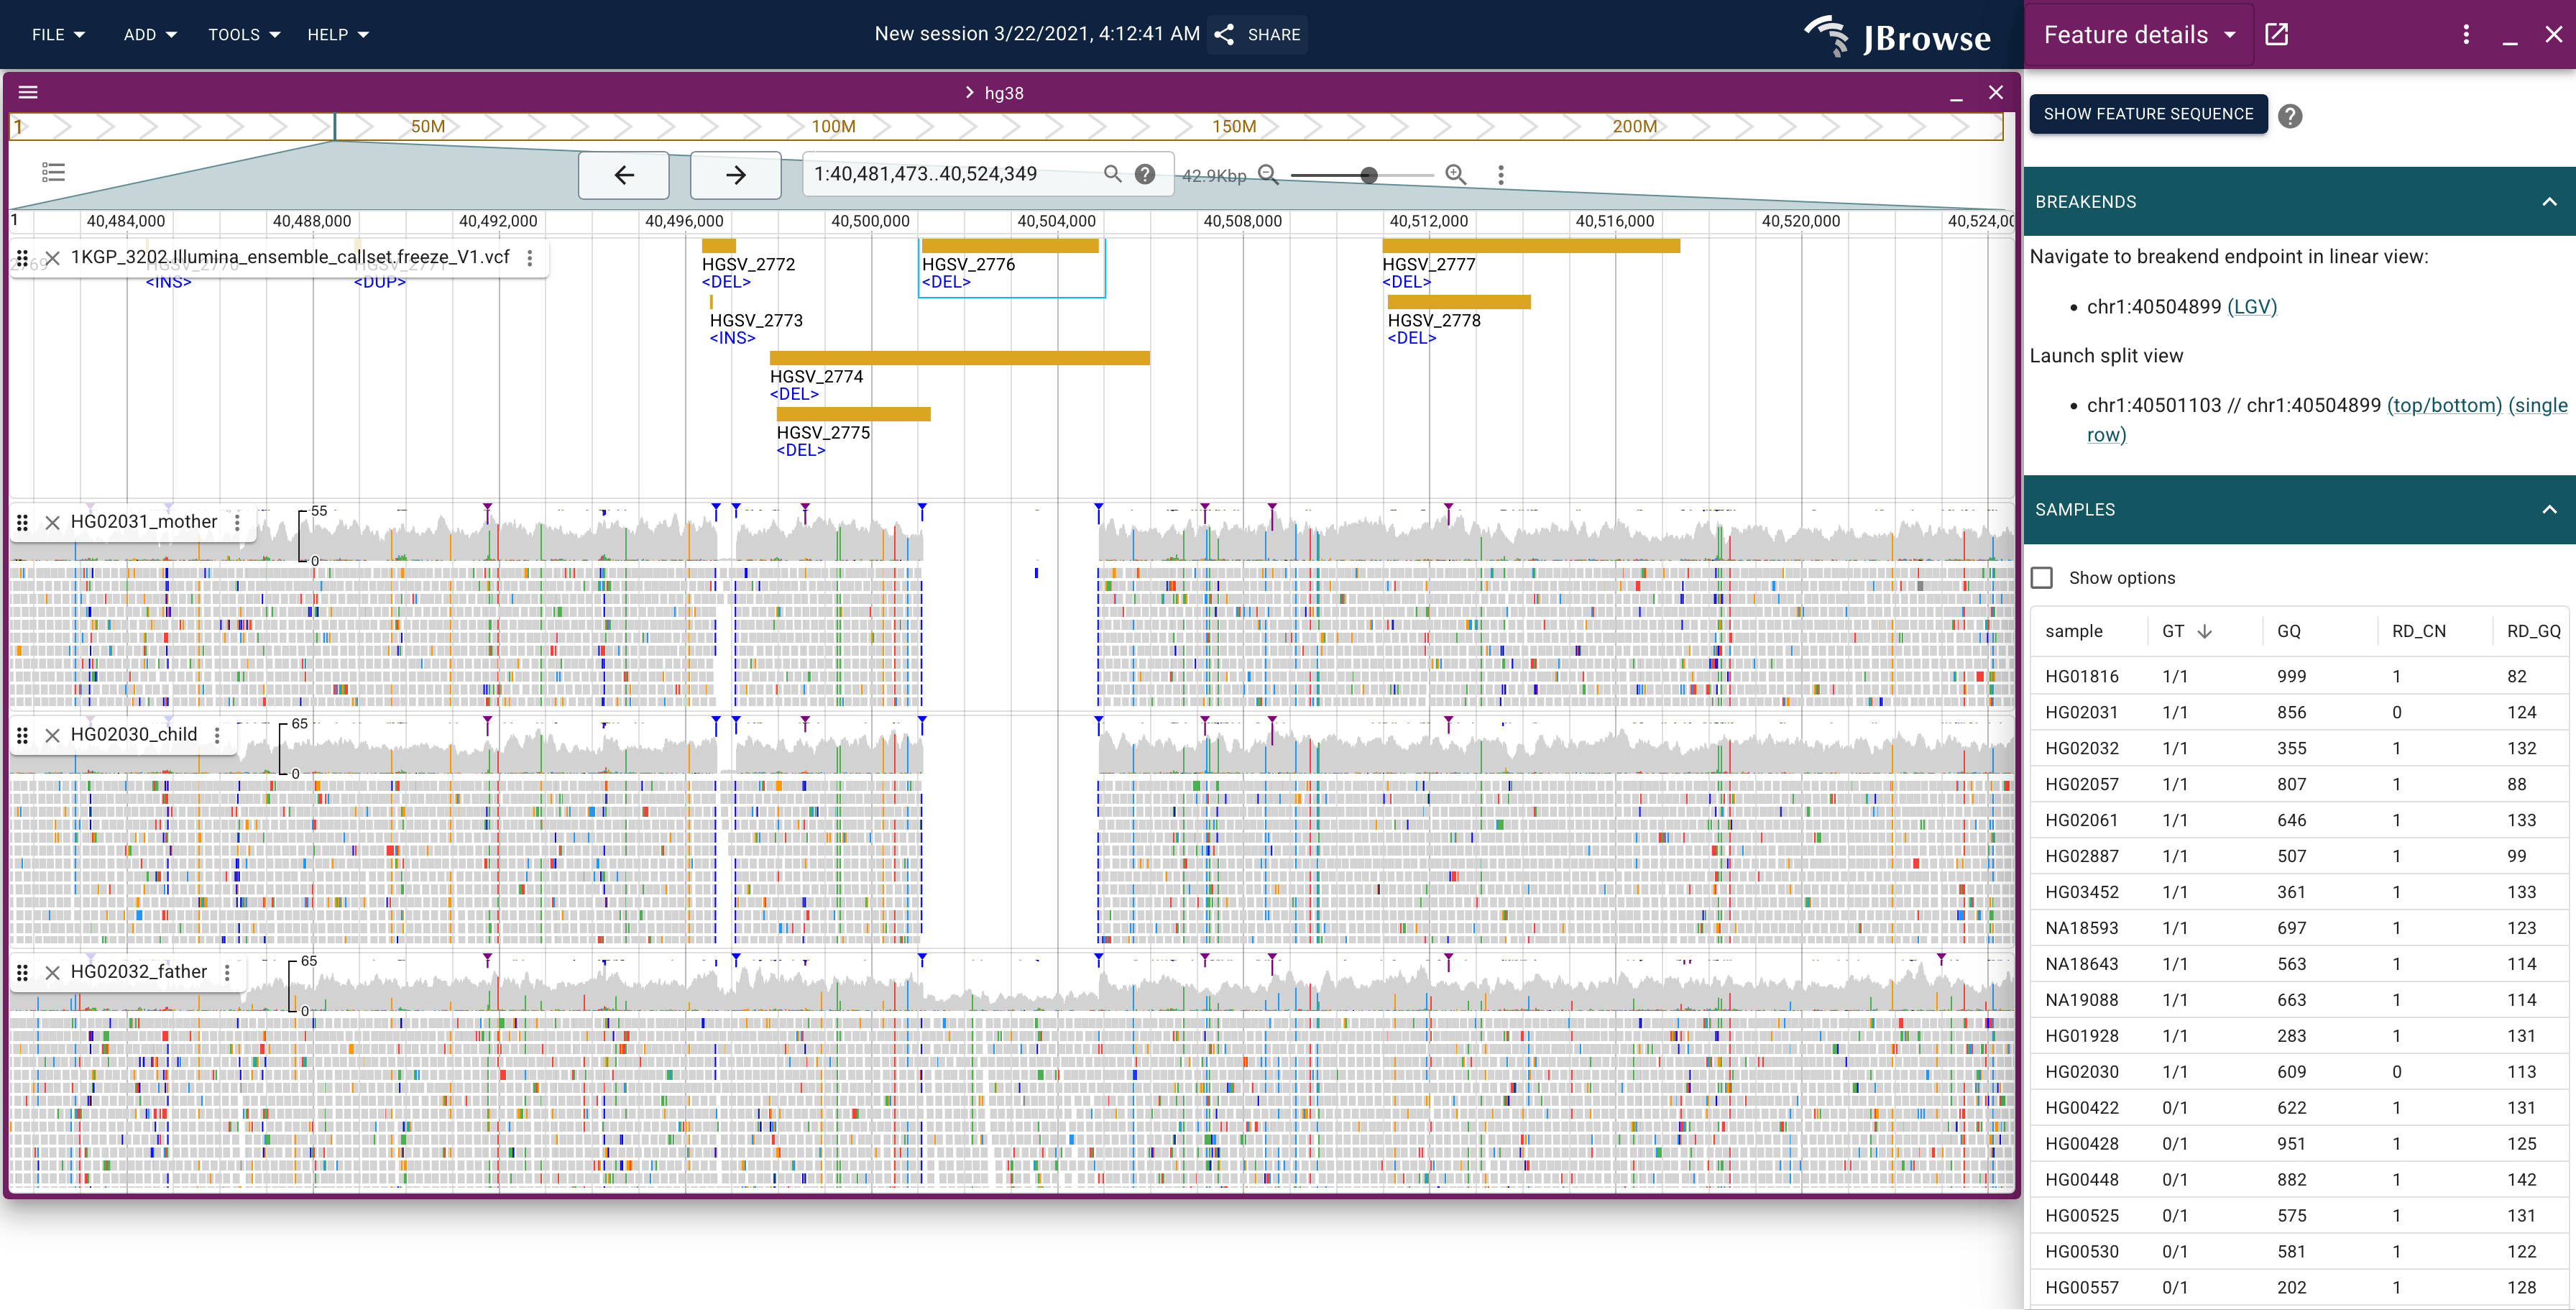
Example showing a deletion in a trio https://jbrowse.org/code/jb2/v3.2.0/?config=%2Fgenomes%2FGRCh38%2F1000genomes%2Fconfig_1000genomes.json&session=share-tzYolAQWOK&password=HGZA4
We can use the Variant widget to sort by samples that have the genotype (e.g. GT being non-zero, zero is the REF allele, any non-zero value is one of the ALT alleles)
Multi-sample variant matrix display
The "matrix" style display allows users to visualize "population VCF" or "multi-sample" VCFs in a way that puts all variants in a dense, matrix-style or heatmap style view
This helps to show various patterns in the data that would be difficult to see if the variants were only plotted at their specific genomic position