
Dotplot view

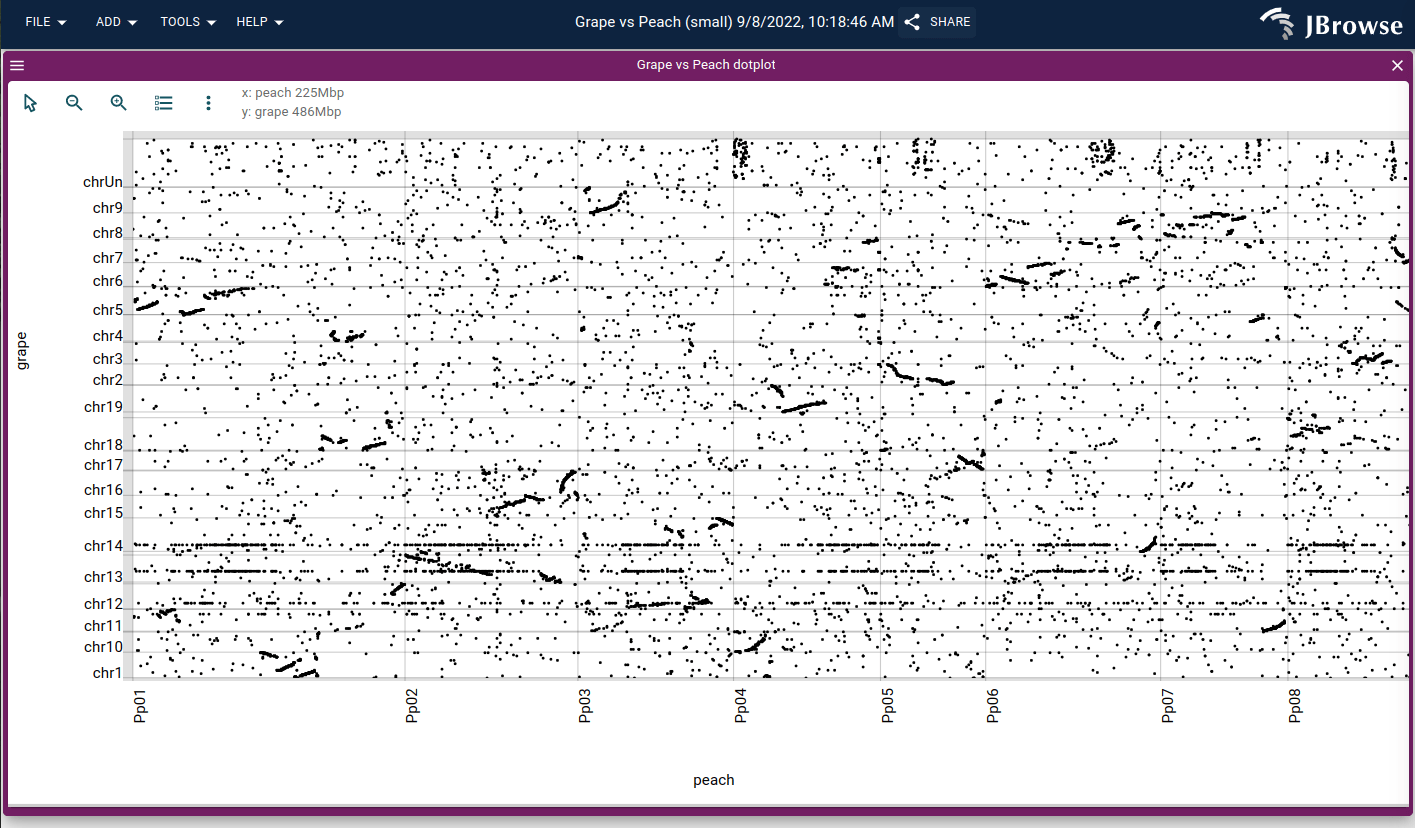
The dotplot view is a 2D comparative view that can display alignments between different genome assemblies, or even compare a long-read or NGS short-read against the genome.

Opening a dotplot view

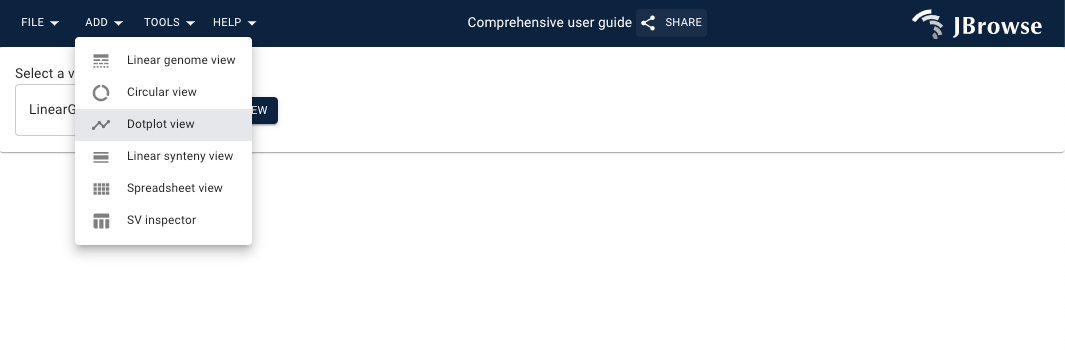
  1. Navigate on the header bar
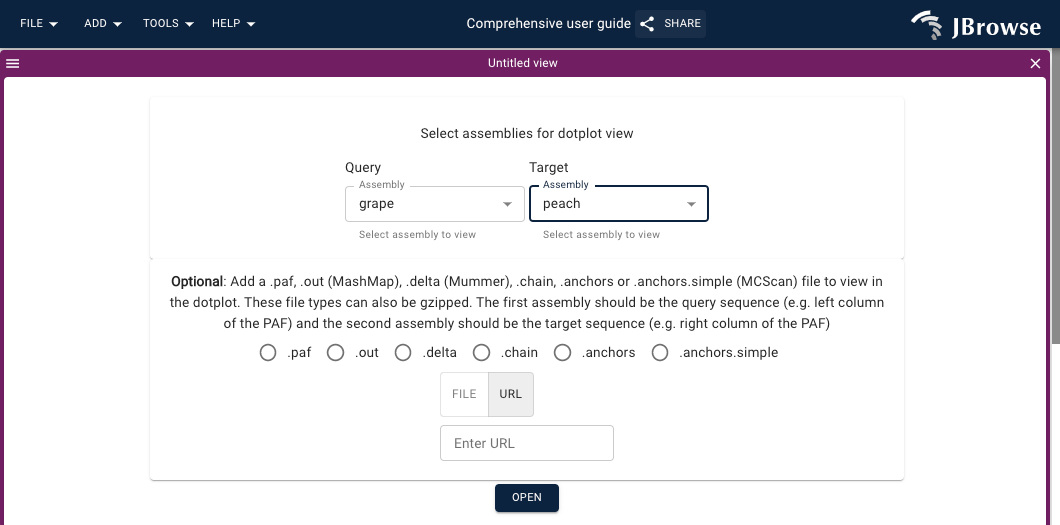
 Add->Dotplot view
  2. Select the genome assemblies of interest
  3. Optionally, add a .paf, .out (MashMap), .delta (Mummer), .chain, .anchors or .anchors.simple (MCScan) file
Adding a new dotplot or synteny view via the menubar.
Screenshot of the import form for a dotplot or synteny view. You can select two different assemblies and an additional file can be supplied.
Screenshot of a dotplot visualization of the grape vs the peach genome.
Screenshot showing the linear synteny view for the grape vs peach genome.

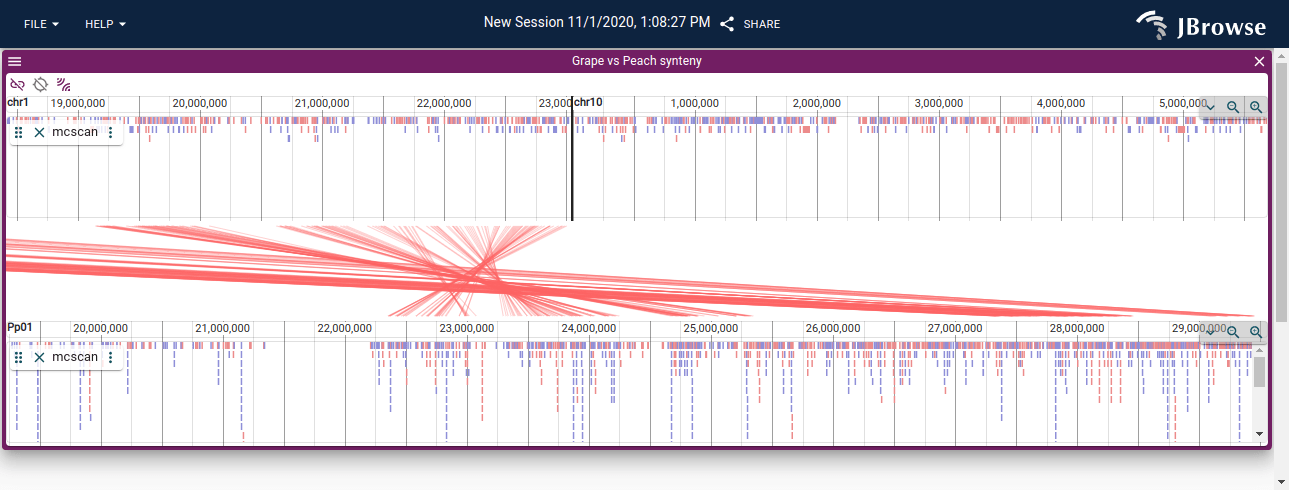
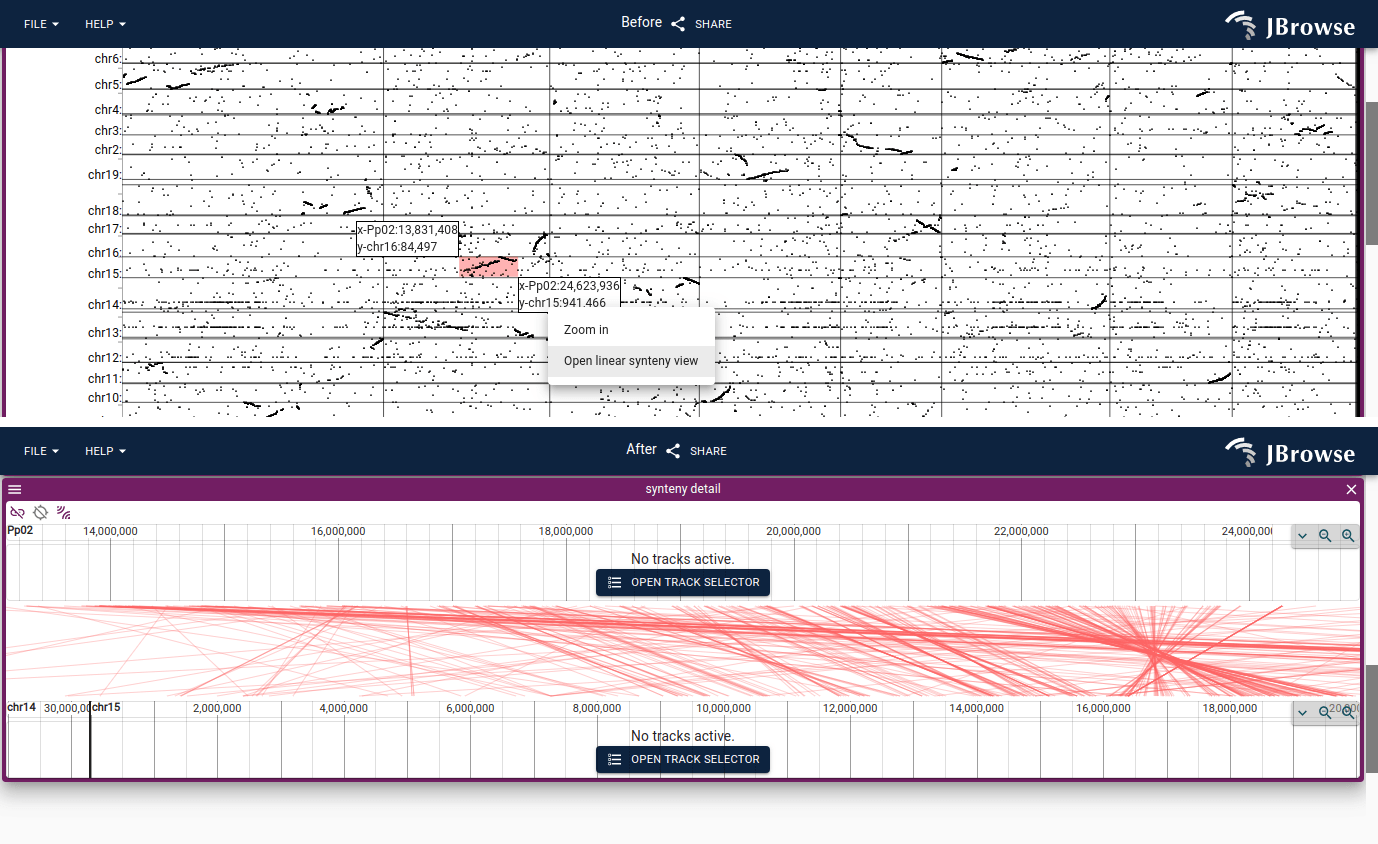
Opening a synteny view from a dotplot view

You can open a synteny view from a dotplot view by selecting a region on the dotplot and clicking "Open linear synteny view", shown below:

Screenshow showing the 'click and drag' selection over the dotplot view which prompts you to open up a linear synteny view from the selected region.